A model that can evaluate the maximal mean power during exercise?
Published:
An inspirational paper
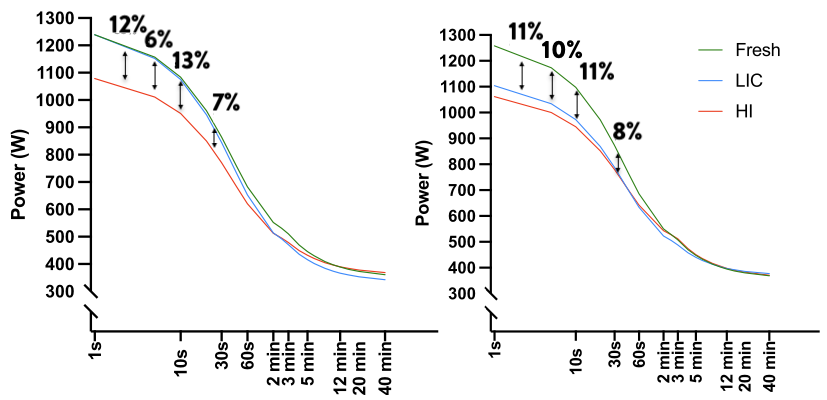
In the last few days, a new-ish published paper (Spragg et al. 2023) caught my attention. The paper has been written by an esteemed research unit that includes eminent researchers in the field of endurance sports and power profiling in cycling. This study investigated the impact of prior work intensity on the power-duration relationship in professional cyclists. Fourteen cyclists underwent three power profile tests: one in a fresh state and two after different fatiguing protocols. The results suggest that the intensity of prior work, particularly for shorter-duration efforts, plays a crucial role in the downward shift of the power-duration relationship, highlighting the importance of considering work intensity beyond just total workload.
The Cover Figure is adapted from the original study, and highlights the meaning behind the downward shift in the maximal mean power values due to the “fatiguing” protocols. (for more discussion on my use of the word, “fatigue”, read below).
The main reason why I felt attracted by this publication is that it aligns perfectly, in my opinion, with the concept behind the Athletica Workout Reserve. Very briefly, the Athletica Workout Reserve does exactly that: it monitors the oscillations of an athlete’s maximal mean power during exercise.
A very simple idea
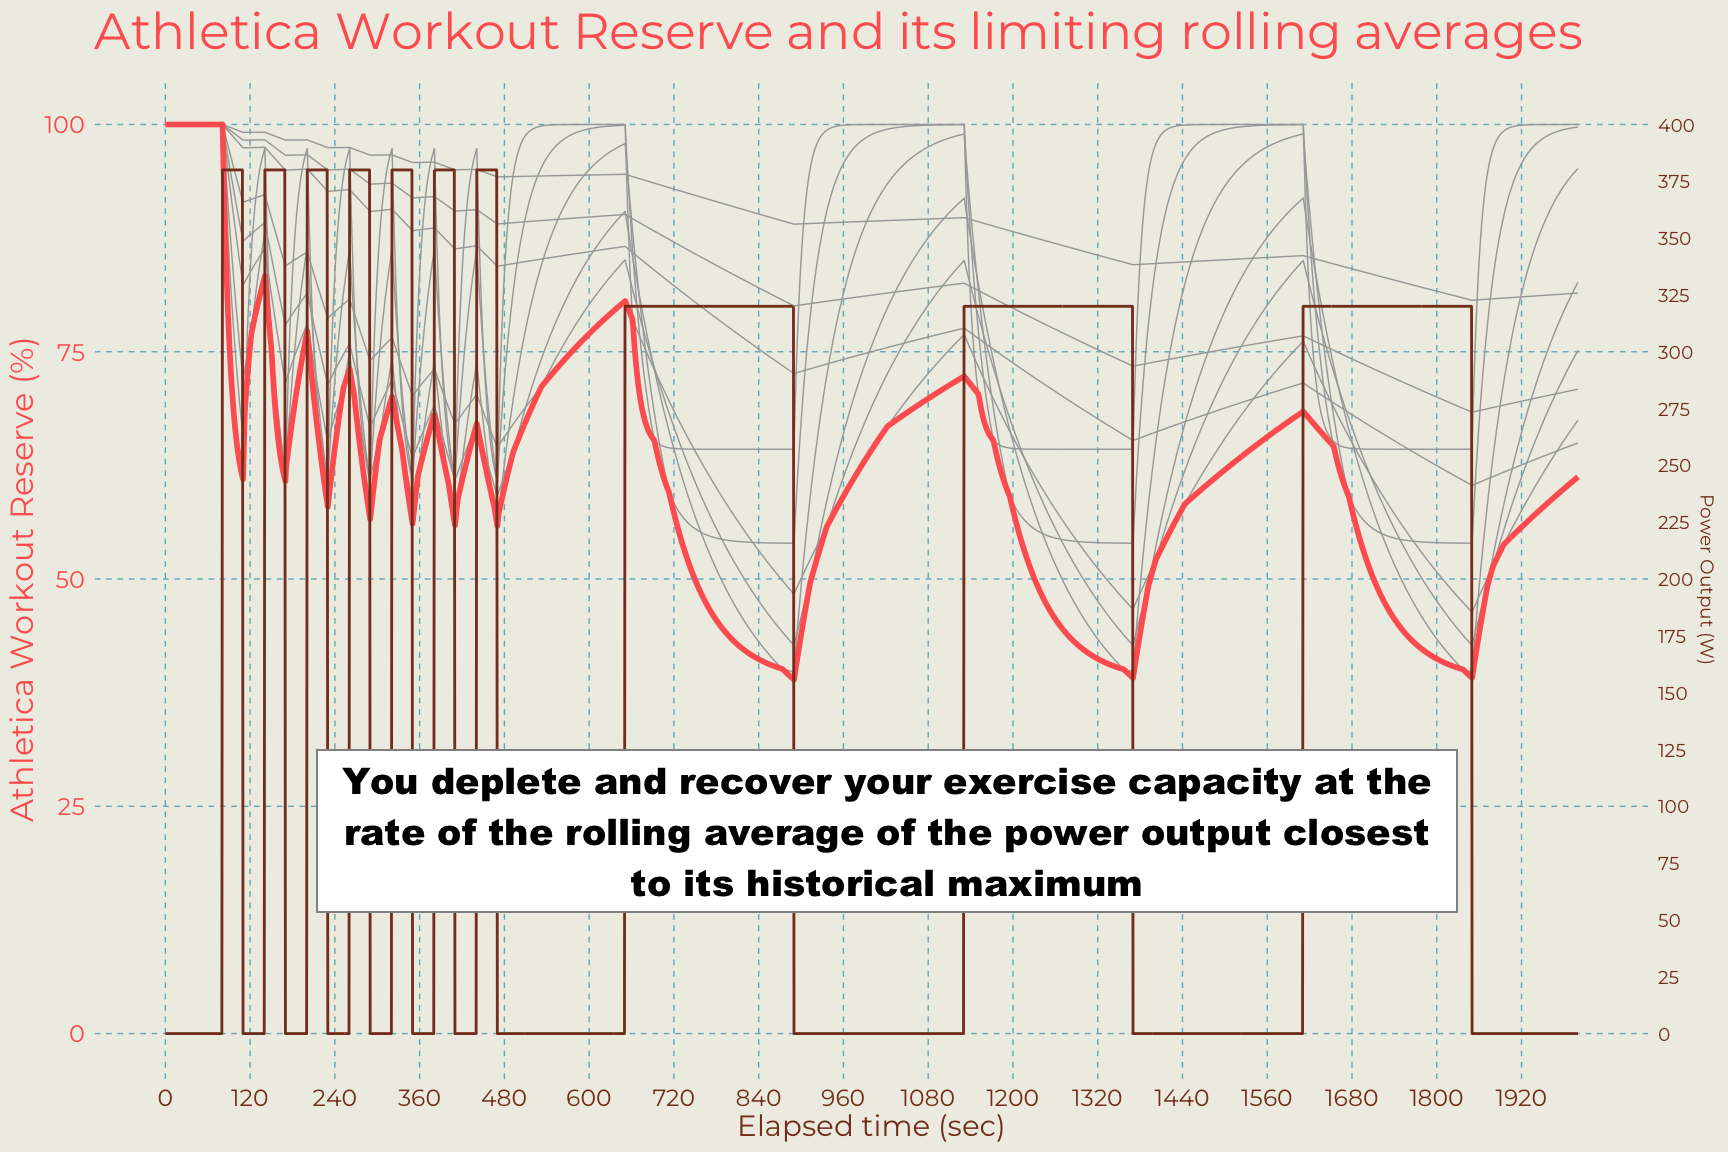
The Athletica Workout Reserve is based on a very (very) simple idea. Actually, it might well represent the simplest model for exercise capacity that I am aware of. As written in Figure 2, if the minimal distance between the exercising maximal mean power and the historical maximal mean power can be used as a proxy for exercise capacity, then we can say that: the exercise capacity is depleted and recovered at the pace of the rolling average of the power output that is closest to its historical maximum. It might sound complicated, but this is the shortest and most generic version I could conceive. When the WR is 0% it means that there is a rolling average reaching the 100% of its historical maximum. That’s it, nothing more nothing less.
It must be noted that this concept can be applied broadly to different endurance activities, not only those that involve power measurements such as cycling and rowing. Indeed, in cycling, the power output is directly related to exercise intensity, so for running we should consider the running speed. The same concept is still valid for running speed profiles and, perhaps in the future, running power profiles.
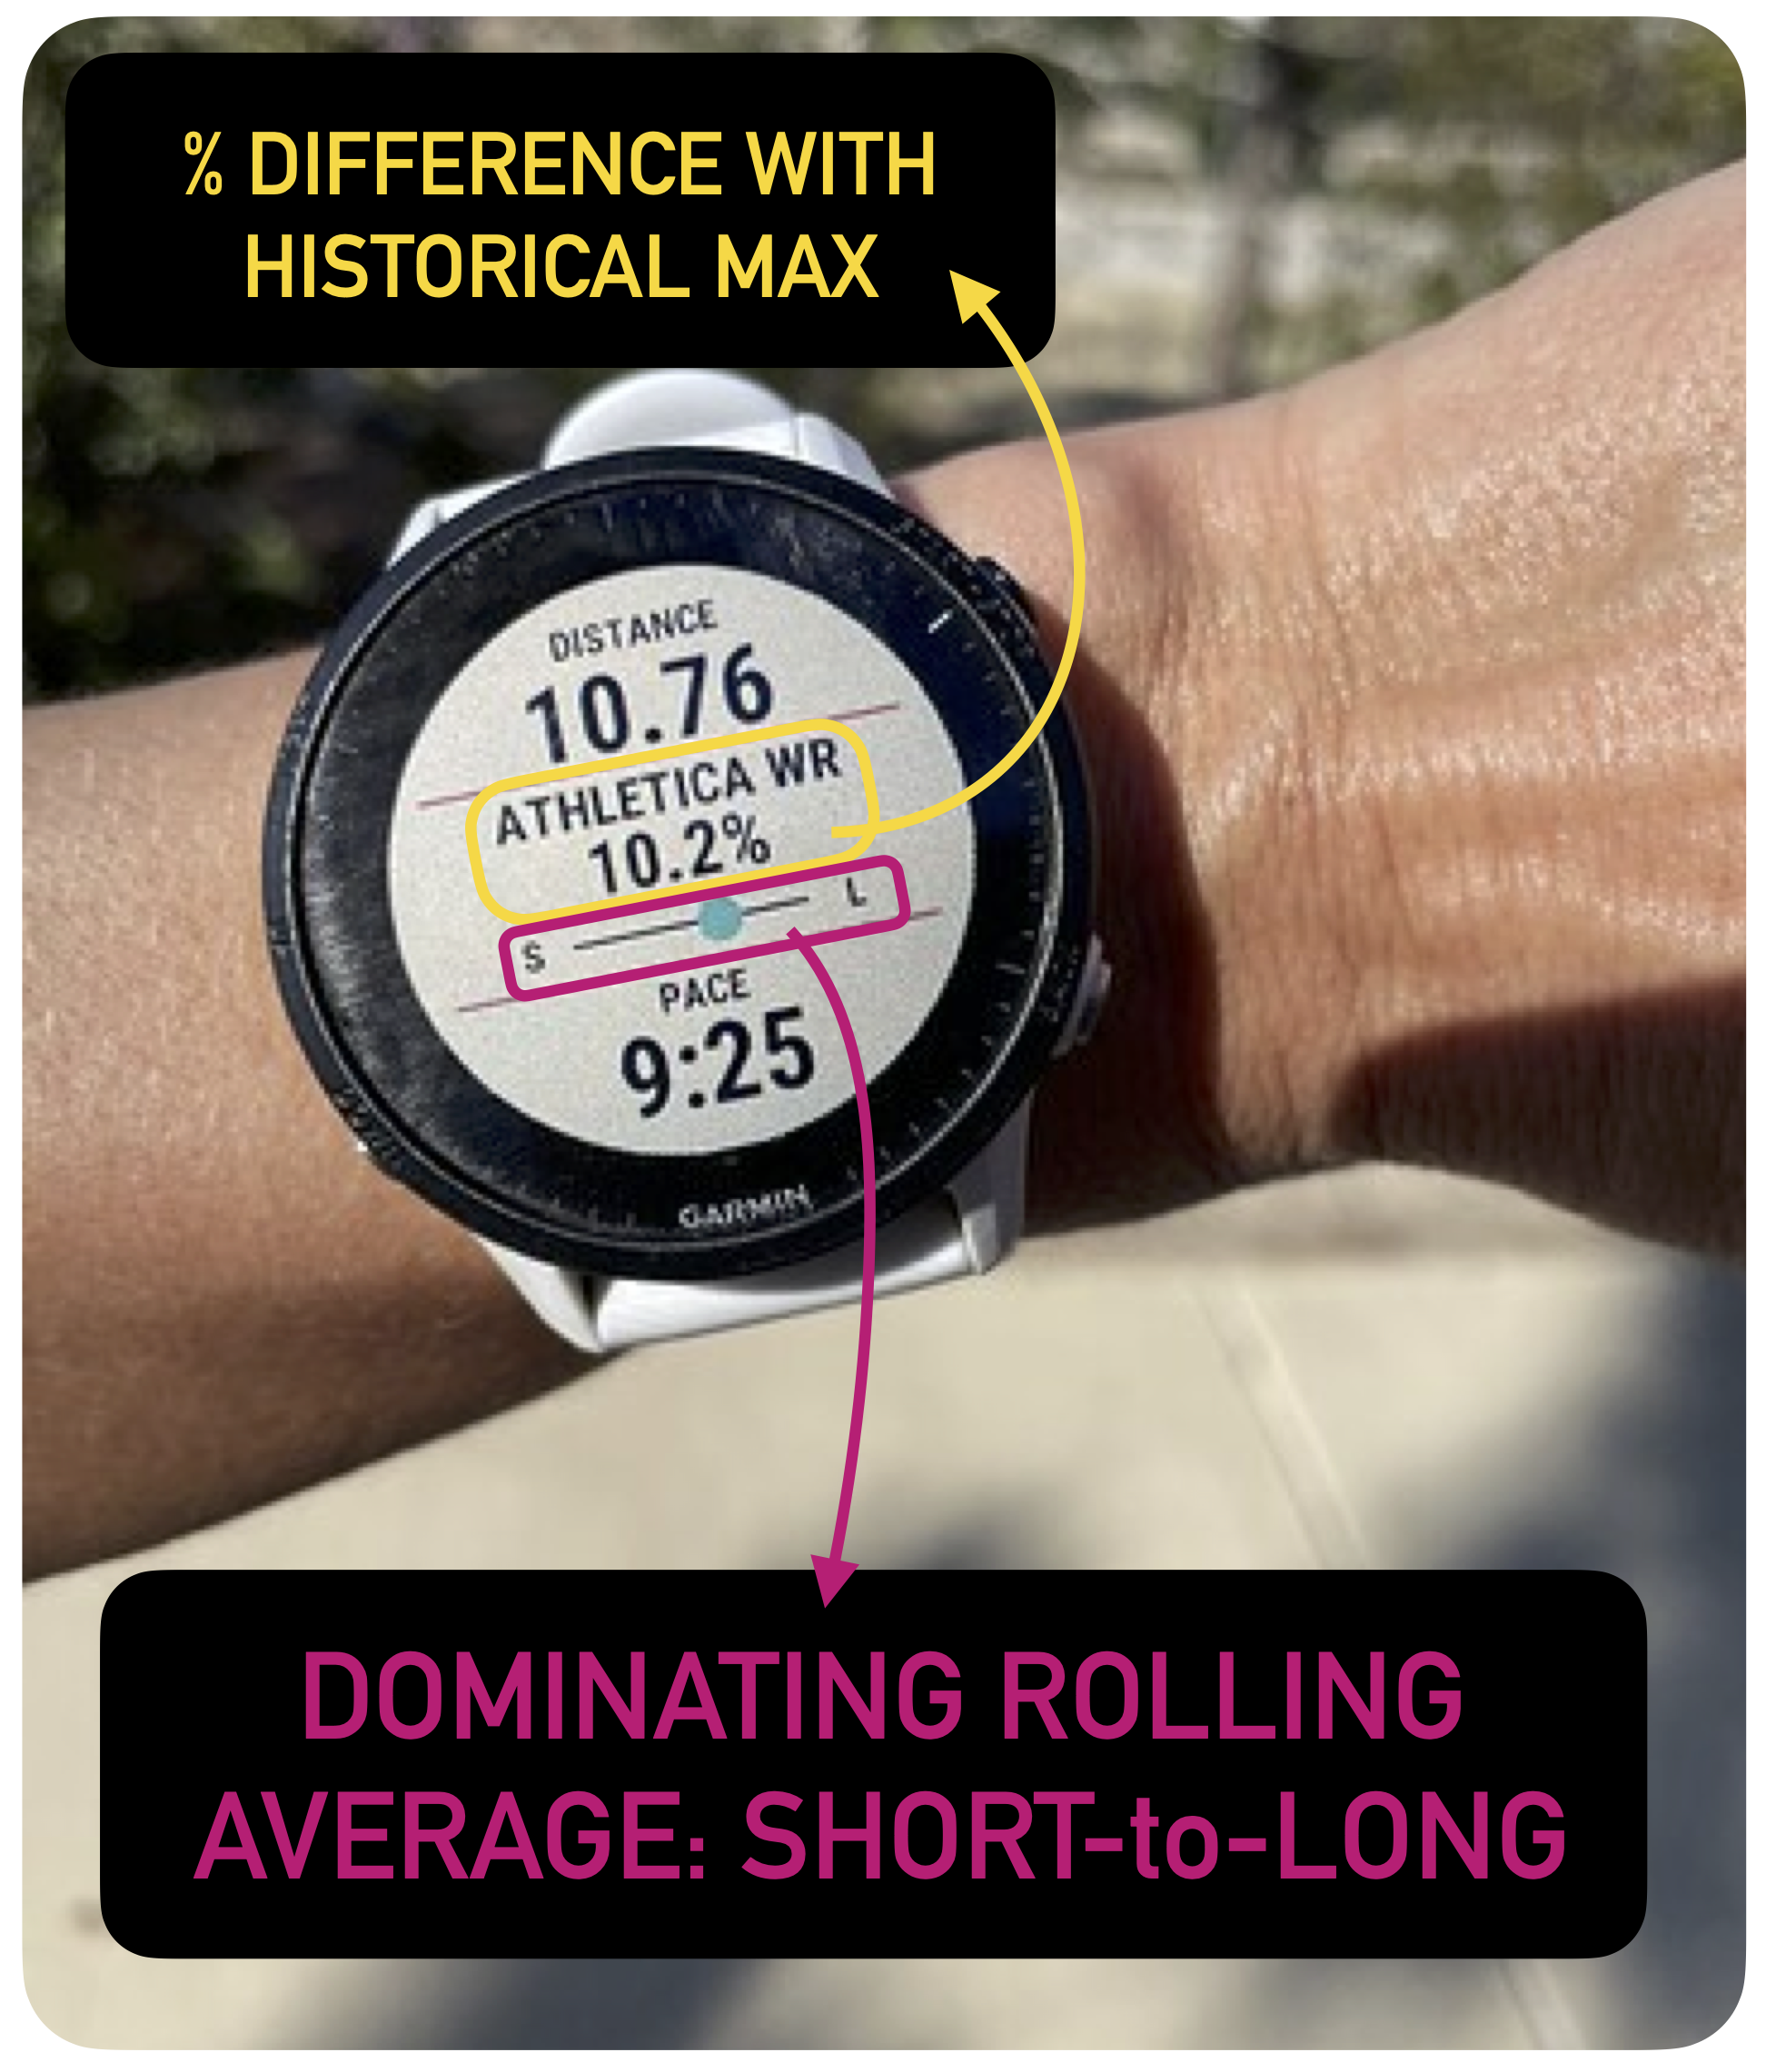
A real-time Garmin application
At Athletica there is no shortage of brain power. I was lucky enough to have a fan in Paul, and he involved Phil in the implementation of the WR concept on the Garmin devices. The app is free to use, but you need a subscription to Athletica, which is also free for a trial.
In Figure 3 a picture taken on a Garmin running the App is presented. As you can notice, the value of the minimum WR is presented in %, along with a slider (available in “advanced” display modality). The % WR tells you how far you are from one of your maximal mean power points, whilst the slider tells you whether these points are those closer to the short-time/high-intensity domain (“S”) or closer to the long-time/low-intensity domain (“L”). I find this pretty cool actually.
Is an athlete always exhausted at WR=0%?
No! Not necessarily. Two perspectives.
1) It might happen that the WR can fall below 0%, which means that a new record is established and that they have set a new maximal mean power for a specific time/intensity-domain. In this case, there is only a simple explanation: the reached maximal mean power during exercise is >100% of the previously known maximal mean power. It’s no secret that the maximal mean power concept relies on maximum efforts to be included in the profile. And, by the way, this is true for each and every forecast model that makes use of historical data to make predictions and inferences about the reality.
2) An athlete can be exhausted before reaching the 100% of their maximal mean power. We should bear in mind that the maximal mean power is populated with the best data we have in the recent history of training/racing. E.g., in Spragg et al 2023, the authors talk about a “fresh” profile, and they adopted a technique that is not exactly the maximal mean profile, but this should not have a huge impact on the conclusions of this post. The WR=0% represents a limit, it’s not a sine qua non condition for exhaustion. Exhaustion can occur before that point. This is due to the fact that unfavourable conditions such as heat or injury might impair the ability of an athlete to push at their maximum limits for that specific time/intensity-domain.
Is the connection with Athletica is necessary?
The main reasons why the WR App needs Athletica is because Athletica can compute your power/speed profile in the way that can be digested by the WR algorithm. Thanks to the invisible monitoring system that Athletica has in place, if an historical maximal mean power is beaten (WR<0%), an athlete’s power/speed profile is automatically updated. Athletes can therefore leverage the internet connection of their Garmin devices to download the last speed/power profile available with their Athletica account before they start a new session/race.
Athletica needs at least 10 sessions to consider your speed/power profile “realiable”. Therefore, if you are starting on a free trial and you want ot test WR from day 0, you might need to use the data already available on your Garmin Connect and/or Strava (either one of these connections is required anyway to let you upload data on Athletica). After a session is completed, the WR is displayed in the data “Analysis” tab of the session. However, the Garmin fit file will be storing the WR values, so they can be visualised with other interfaces.
How can I use WR in training and racing?
We still have limited experience on how to use the WR during exercise and racing. Some examples have been collected in a blog post. It is all speculative at the moment, and very experimental.
Whether this tool can be used to assess an athlete’s “fatiguability” is an open question. What is also unknown is whether WR can be somehow associated with rating of perceived exertion (RPE). It is natural to think that the closer an athlete is to their maximum, the higher the RPE. Also, very brief maximal exercise might elevate RPE for shorter amount of time compared to long duration efforts. In these terms, it sounds like the dynamics of RPE might be associated with WR (again, all speculative at the moment).
The great advantages of WR, is that: 1) this can be assessed in real-time, and 2) the specific time/intensity domain that leads to exhausiton can be revealed.
All-in-all the WR holds some promise and, in my view, it aligns well with the rising concepts of “durability” and “moving thresholds”. Indeed, for WR, there are no thresholds at all, just upper limits.
Note about “fatigue”
The reason I used quotes for the word “fatigue” is because, to my knowledge, the downward shifts in maximum mean power have not yet been associated with standard markers of fatigue, such as maximal voluntary contraction, etc. I maintained the terminology adopted in the paper by Spragg et al. to ensure consistency.
References, additional readings, and content
- On power profiling: Leo et al. 2022
- On durability: Maunder et al. 2021
- On downward shifting of maximal mean power in fatigued conditions: Spragg et al. 2023
- Rationale behind the Workout Reserve concept Zignoli 2023, preprint
- On ventilatory threshold changes in fatigued conditions: Gallo et al. 2024
To test the app for free:
- Learn more about this concept on the HIIT Science blog on Workout Reserve
- If you are interested, check if you have a compatible device here
- Set up an Athletica account here, and you can start a free trial and cancel anytime you want
- Download and install the Garmin App, following instructions here
- Read about how to use the Workout Reserve Garmin App in training and racing
- Report your experience and engage with other early adopters on the vibrant Athletica forum